
Greater control over cloud spend. Faster financial analysis. Clearer reporting.
Technology and finance teams need reliable answers to recurring questions. Why did spend change? Who should have access to cost data? Which areas need attention?
September’s Yarken updates make these questions easier to address.
New Cloud Access Policies strengthen data governance. Ask Yarken brings conversational analysis into dashboards, while expanded visualizations and publishing controls help teams investigate spending patterns and share financial information more effectively.
Govern cloud spend with greater precision
As cloud reporting reaches more teams, controlling access to financial data becomes increasingly important.
Cloud Access Policies
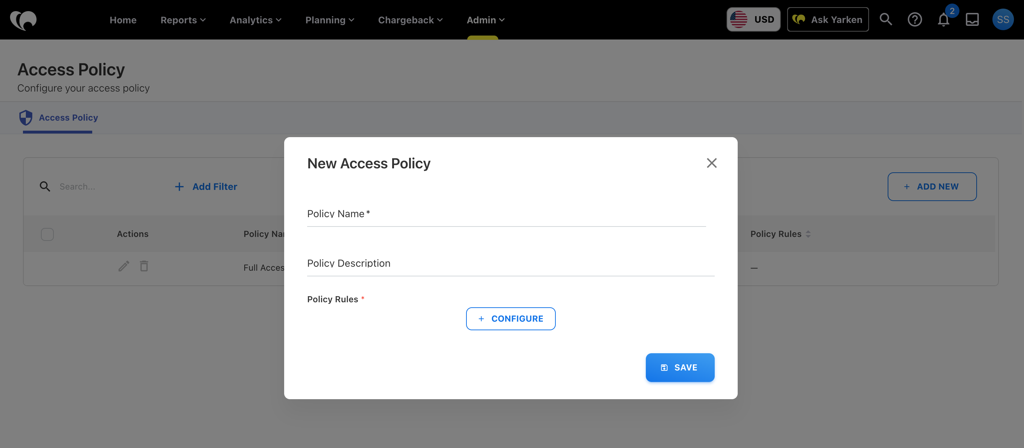
Yarken now supports Cloud Access Policies, allowing administrators to control which cloud cost data each user can access.
Policies can use supported attributes such as cloud provider and billing account to include or exclude specific data.
These restrictions apply consistently across Dashboards, Analytics, Ask Yarken, Insights, exports, and APIs.
Access Policies work alongside existing permissions, with policy changes and assignments recorded in the Audit Log.
For CIOs, FinOps leaders, and IT Finance teams, this means greater control over financial visibility as reporting expands across departments.
Investigate spend directly from your dashboards
A financial dashboard might show rising costs. Understanding what changed often requires further investigation.
September brings that investigation closer to the data.
Ask Yarken now supports conversational dashboard analysis
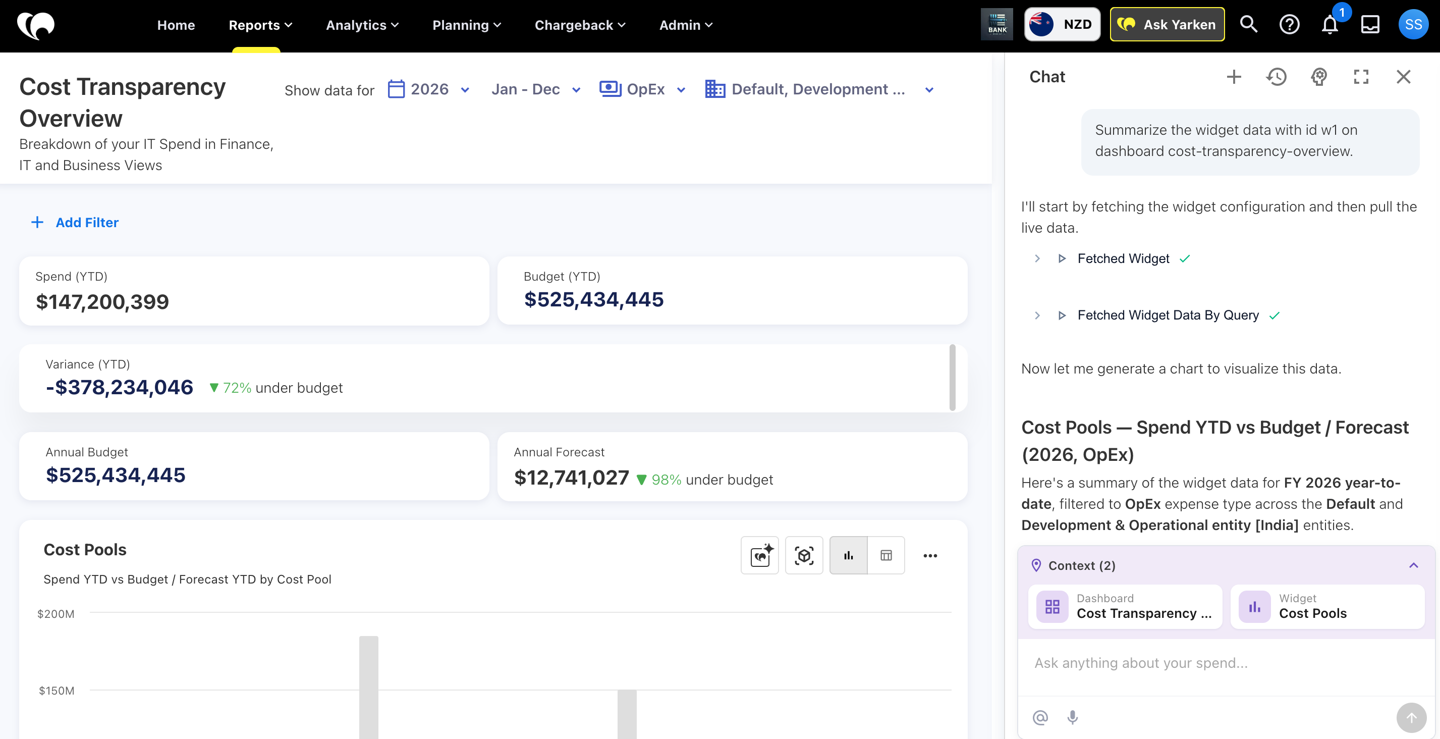
Graph Explanation Copilot now lets teams investigate supported charts and widgets through follow-up questions.
Ask Yarken retains context from the selected dashboard, allowing teams to explore trends, compare reporting periods, and adjust supported filters.
For example, a finance leader reviewing monthly expenditure can ask:
“How has cloud spend changed compared with last month?”
They can continue investigating within the same dashboard context without starting a separate analysis.
Custom Dashboards also now support a dedicated Ask Yarken widget, with configurable suggested questions. Dashboard creators can generate questions from available widgets, then review and refine them.
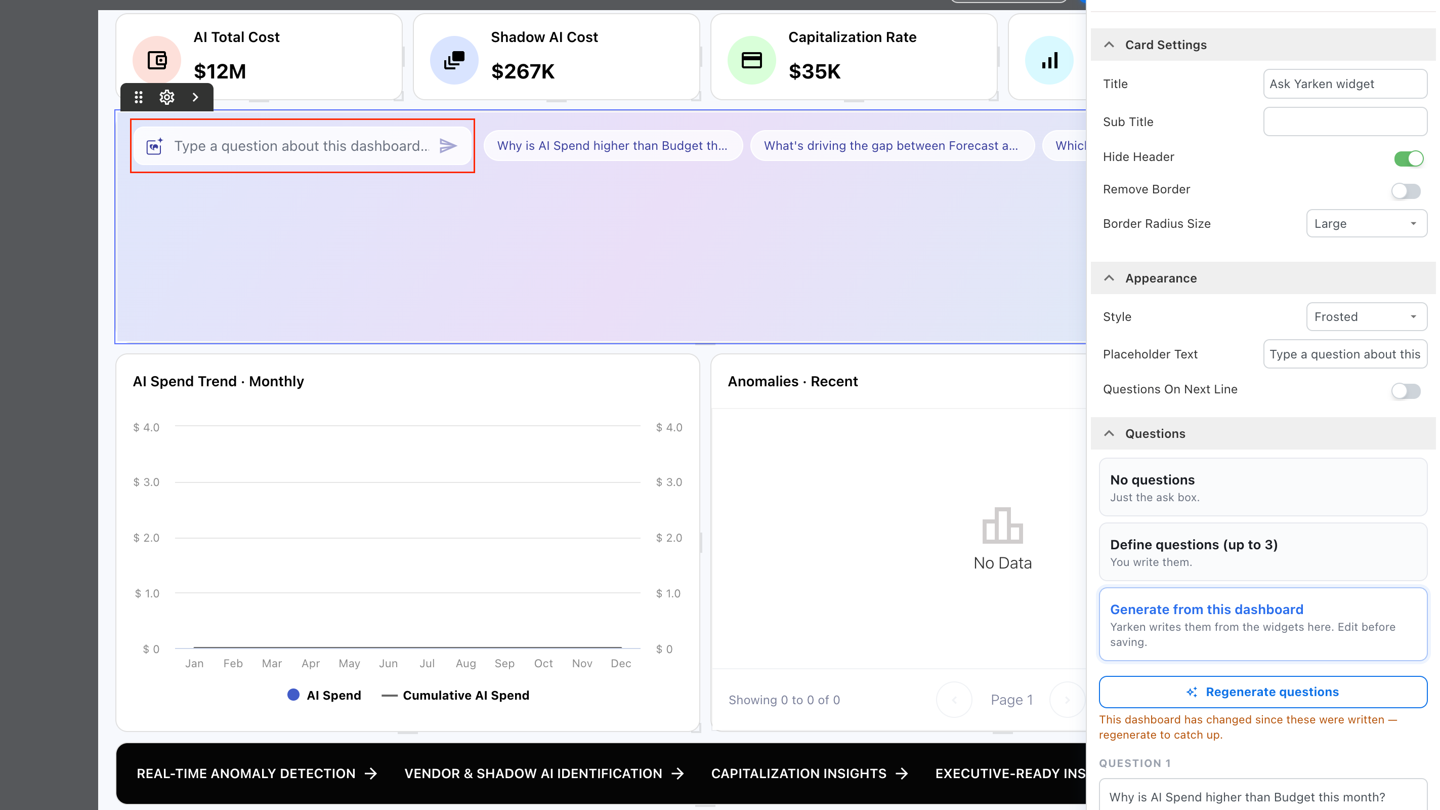
This helps teams investigate financial movement while keeping relevant reporting context in view.
See patterns and exceptions more clearly
Financial data becomes easier to interpret when teams can compare relationships, spot unusual movements, and focus on meaningful changes.
September introduces several visualization and reporting enhancements.
Heat Maps and Scatter Charts
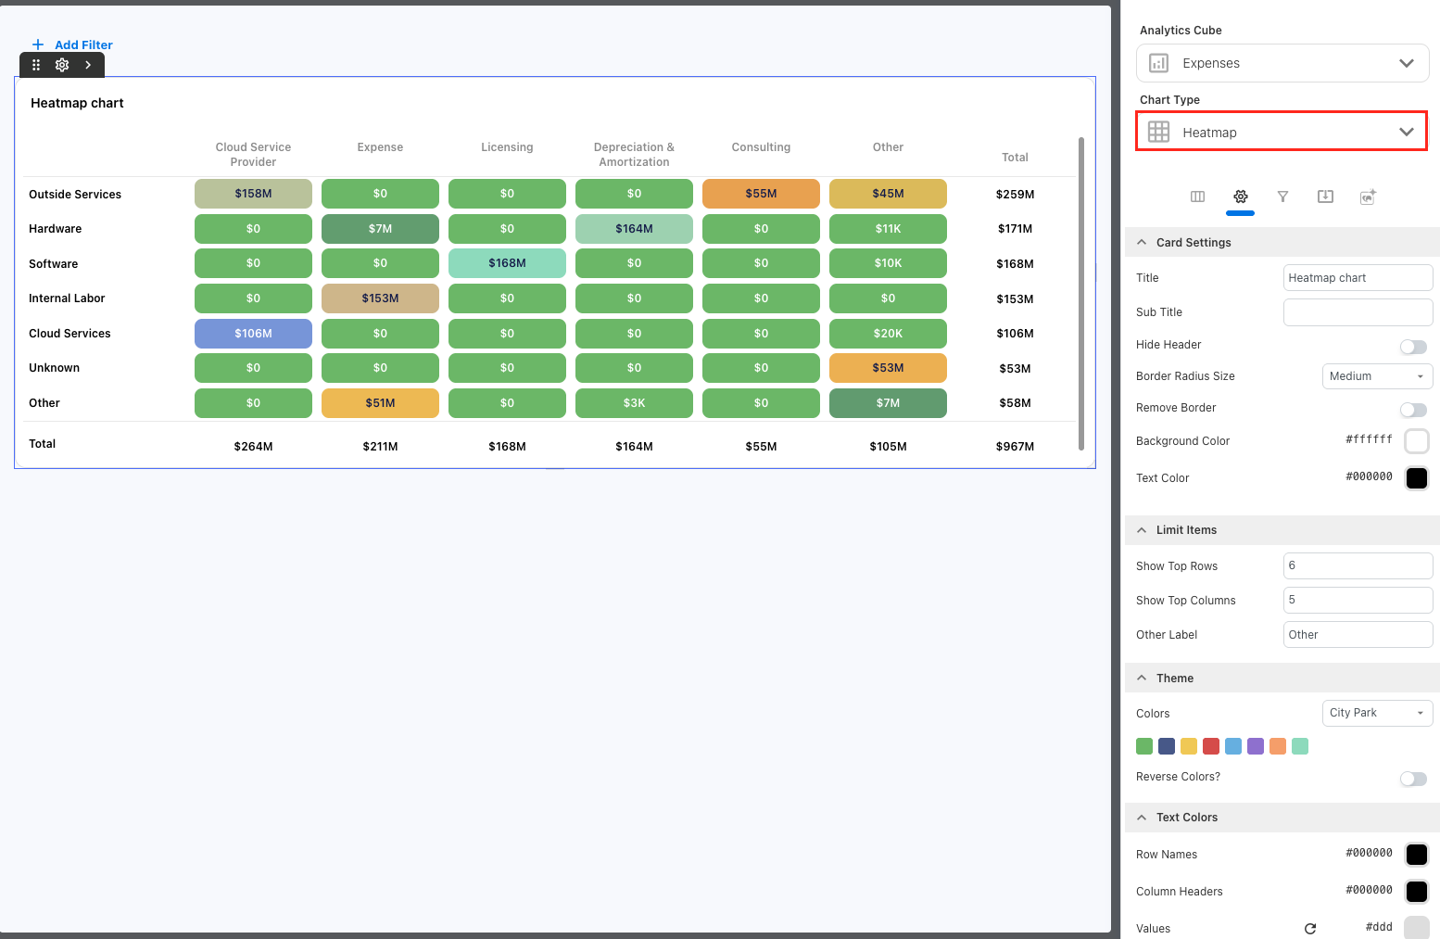
New Heat Maps make it easier to compare values across two dimensions.
Teams can examine spending across vendors and cost centers, identify concentrations, and investigate unusual patterns through drill-downs or Ask Yarken.
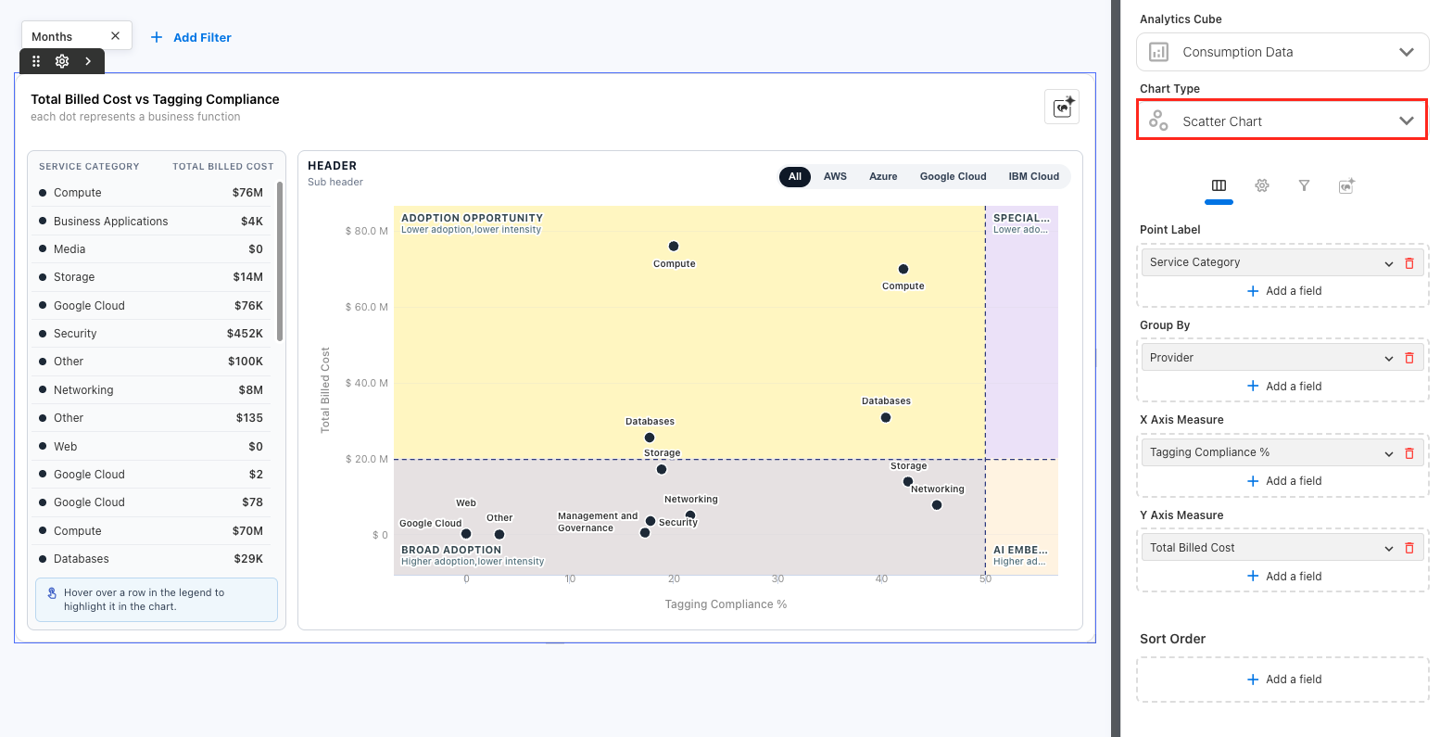
Scatter Charts help compare two measures, such as application cost and usage, to identify relationships, clusters, and outliers.
Z-Score bounds and smarter comparisons
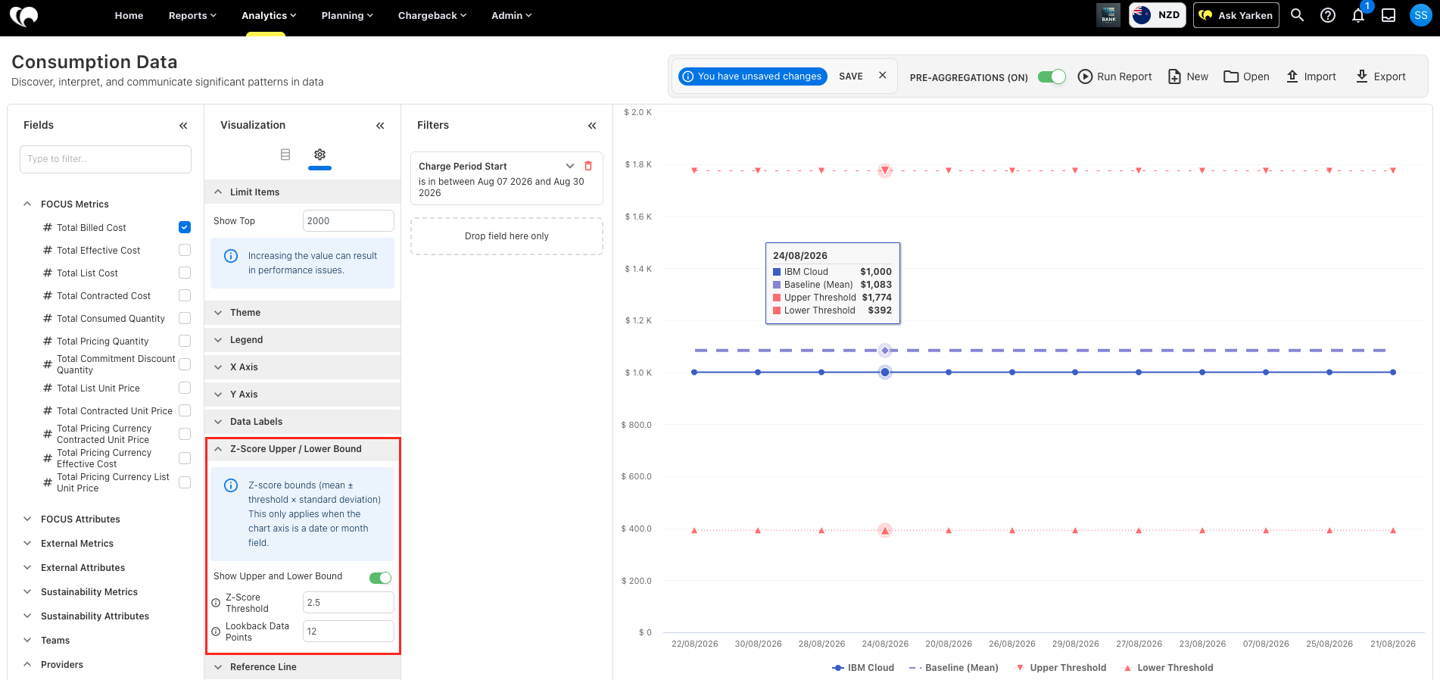
Supported line charts now display configurable Z-Score upper and lower bounds, helping teams identify values outside expected statistical ranges.
Additional improvements include:
- Top N and Other grouping to focus charts on important categories.
- Previous-year KPI comparisons to track changes in value and percentage.
- Linear trendlines to visualize projected trends from historical data.
- Enhanced Proportional Bars for clearer comparisons across categories.
These capabilities give Finance and FinOps teams more ways to examine changes before deciding where to investigate.
Publish and manage reporting with greater control
Bring Custom Dashboards into Yarken’s navigation
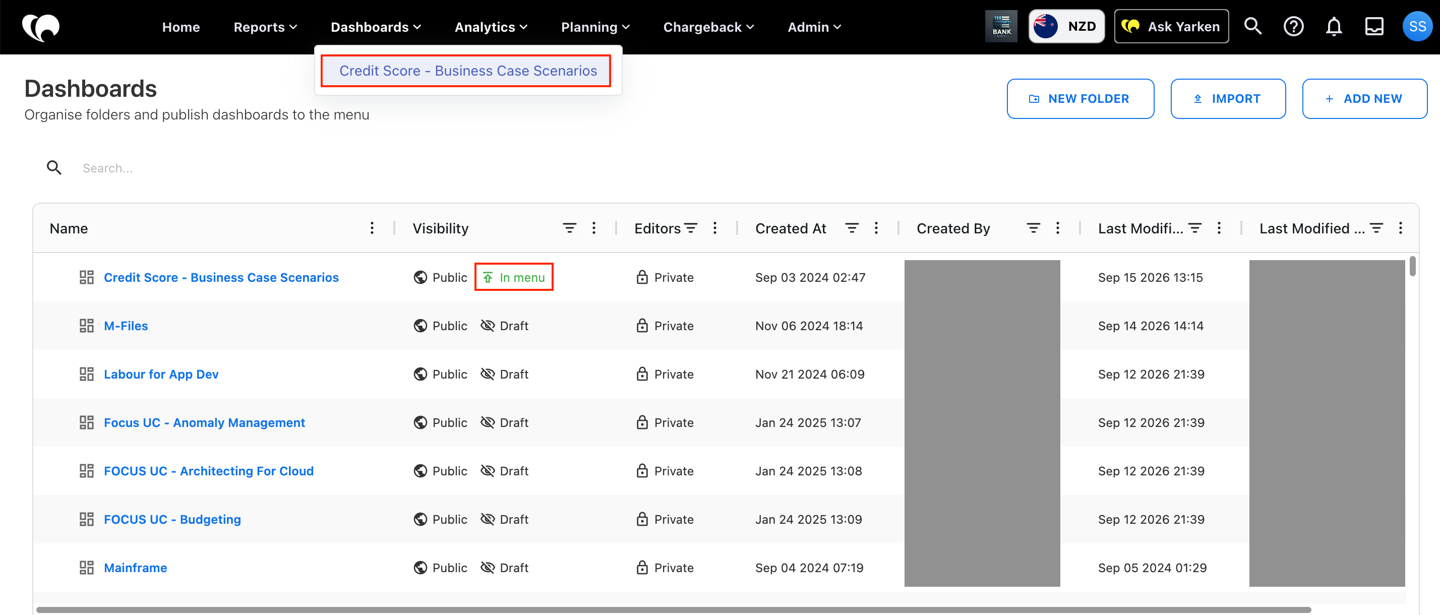
Custom Dashboards can now be published directly to the Yarken menu.
Teams can organize dashboards into folders, control display order, and keep unfinished dashboards unpublished.
This makes recurring financial and operational reports easier to find without crowding navigation with working drafts.
Choose how cloud spend enters your financial model
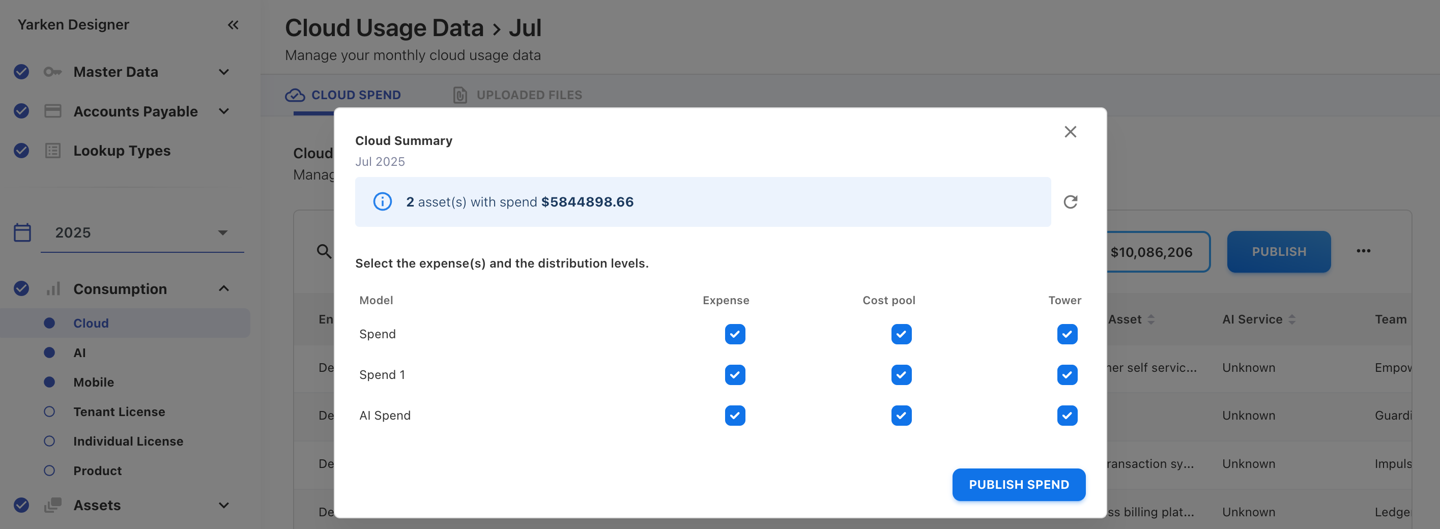
Cloud Publish now allows teams to select how far spend is distributed within each selected Spend model.
Choose Expense, Cost Pool, or Tower, depending on reporting and allocation requirements.
The Cloud Summary displays selected models and distribution levels before publishing, giving teams clearer control over how cloud expenditure enters the financial model.
More improvements across Yarken
September also adds improved data table pagination and totals, better asset upload date validation, and an Email field for Employee Assets.
These changes support more reliable data processing and everyday reporting.
Clearer financial decisions start with better control
September strengthens three important parts of technology financial management: governing access to cost data, investigating financial movement, and sharing trusted reports.
For enterprise technology and finance teams, these improvements support greater accountability, more focused analysis, and better control over how spend is reported and allocated.
Explore the Yarken Changelog for complete release details.