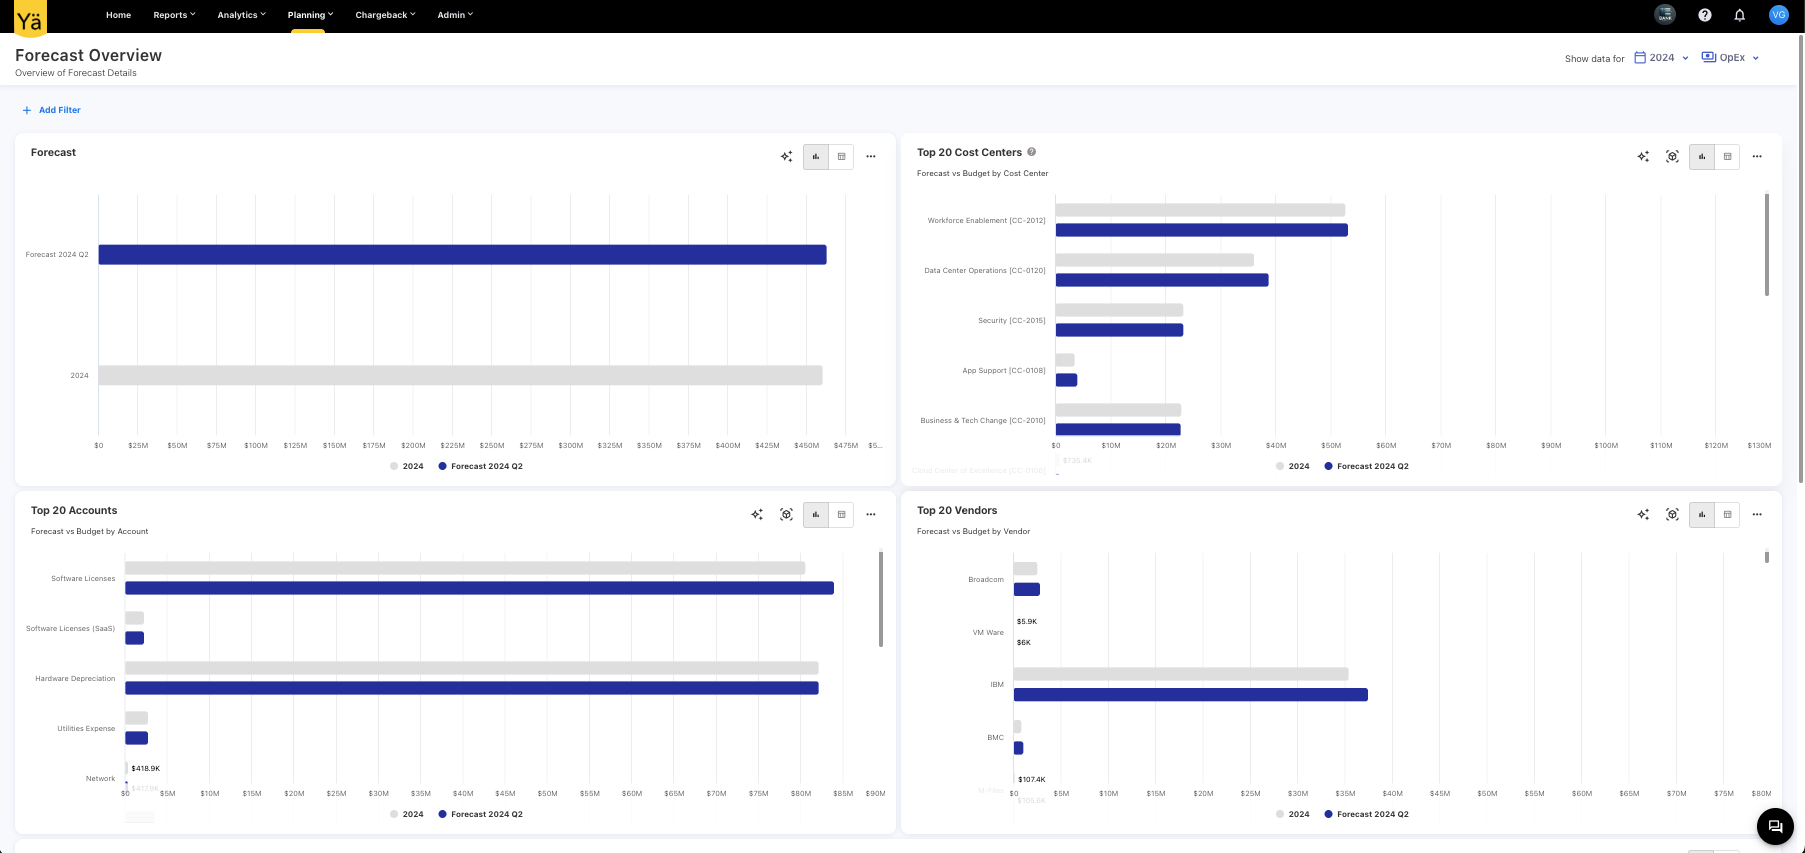
Forecast Overview: Comprehensive Spend Analysis
We have introduced a new Forecast Overview dashboard under the Planning menu. This enhancement provides a comprehensive analysis of forecasted spending, comparing values against approved budgets and visualizing monthly trends for superior financial planning.
Identify top-20 vendors, cost centers, and accounts with the highest forecasted spend, while the Monthly Forecast Details charts provide clear spending patterns on a month-by-month basis.
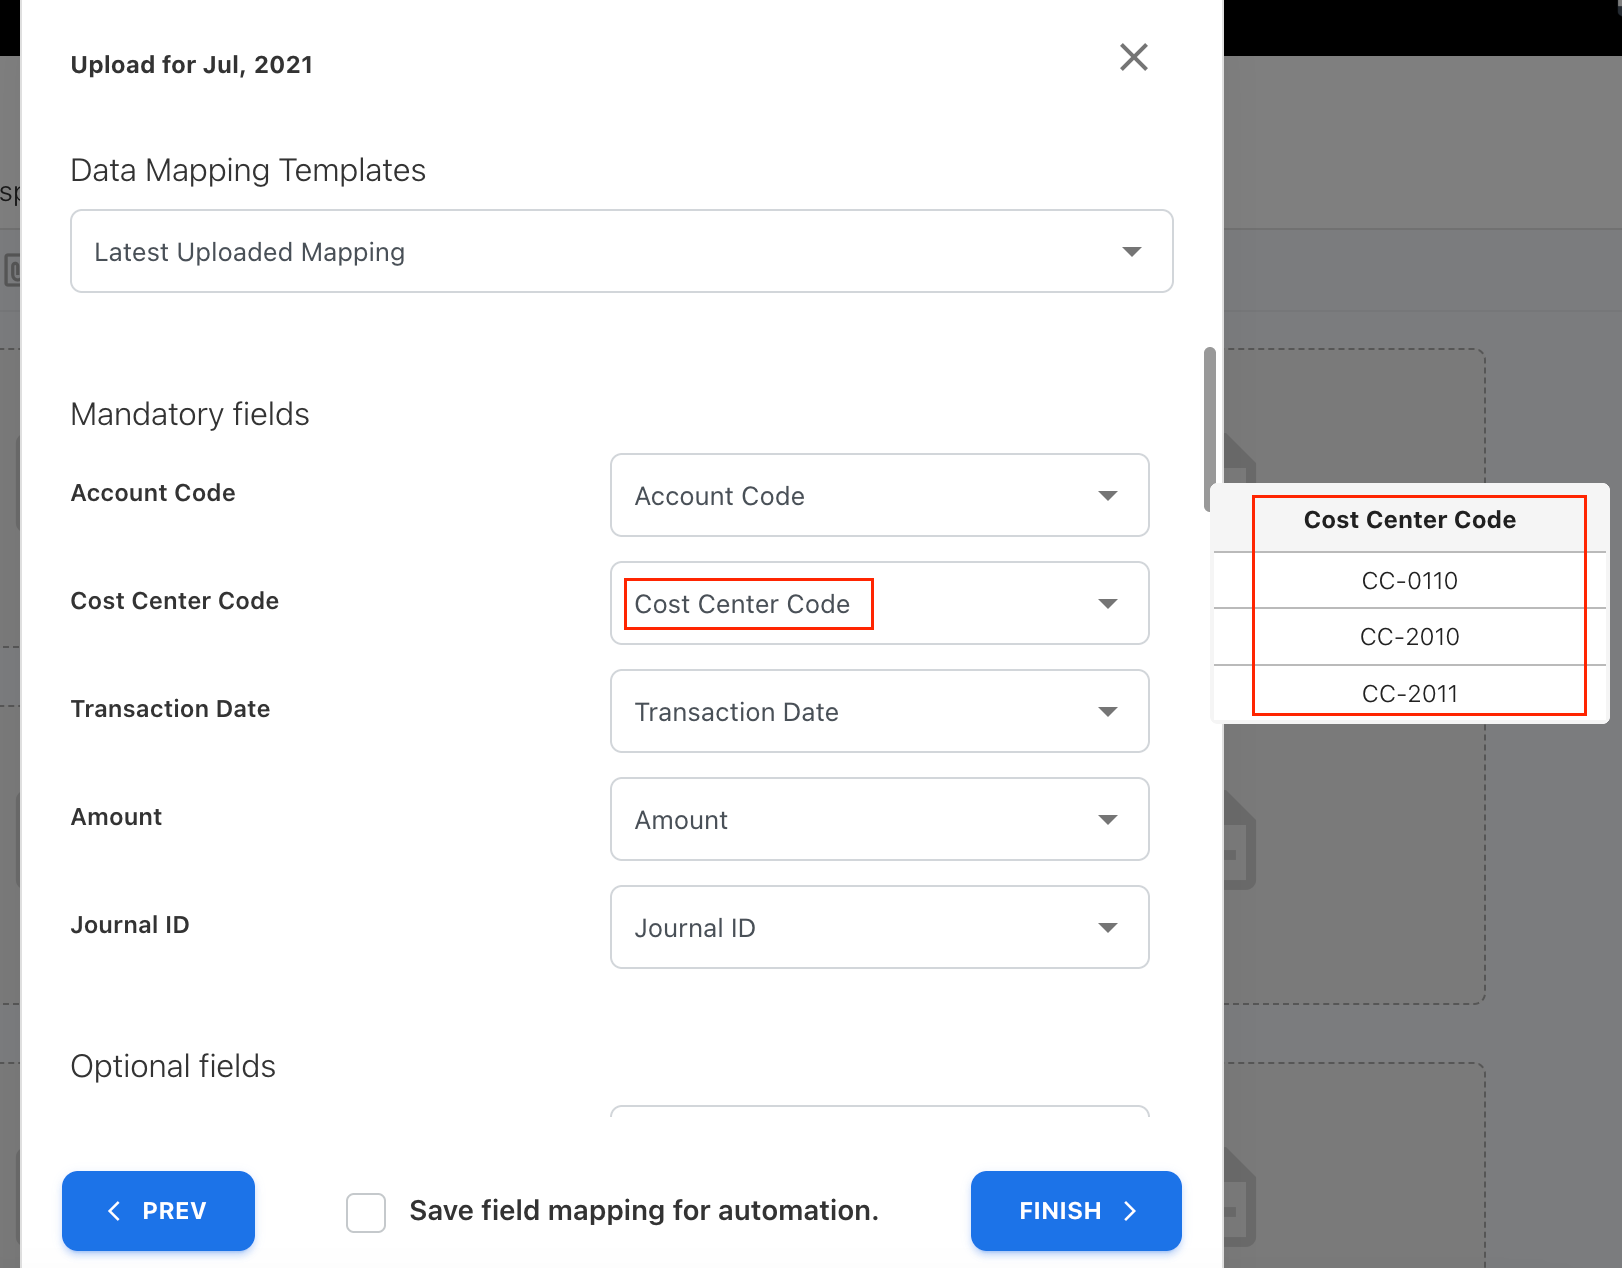
Top Values on Tooltip
We’ve improved the manual mapping experience with the new value preview feature. When hovering over a field, the application now displays the top three unique values as a tooltip, helping you quickly identify relevant mappings.
New User Role: Dashboard Only
Designed for stakeholders or external users, this role provides a simplified experience focused solely on custom dashboard data without full application access.
- • Limited Menu: Only the home page is visible.
- • Targeted Visibility: Only assigned dashboards are shown.
- • Read-Only: Strict viewing/filtering permissions only.
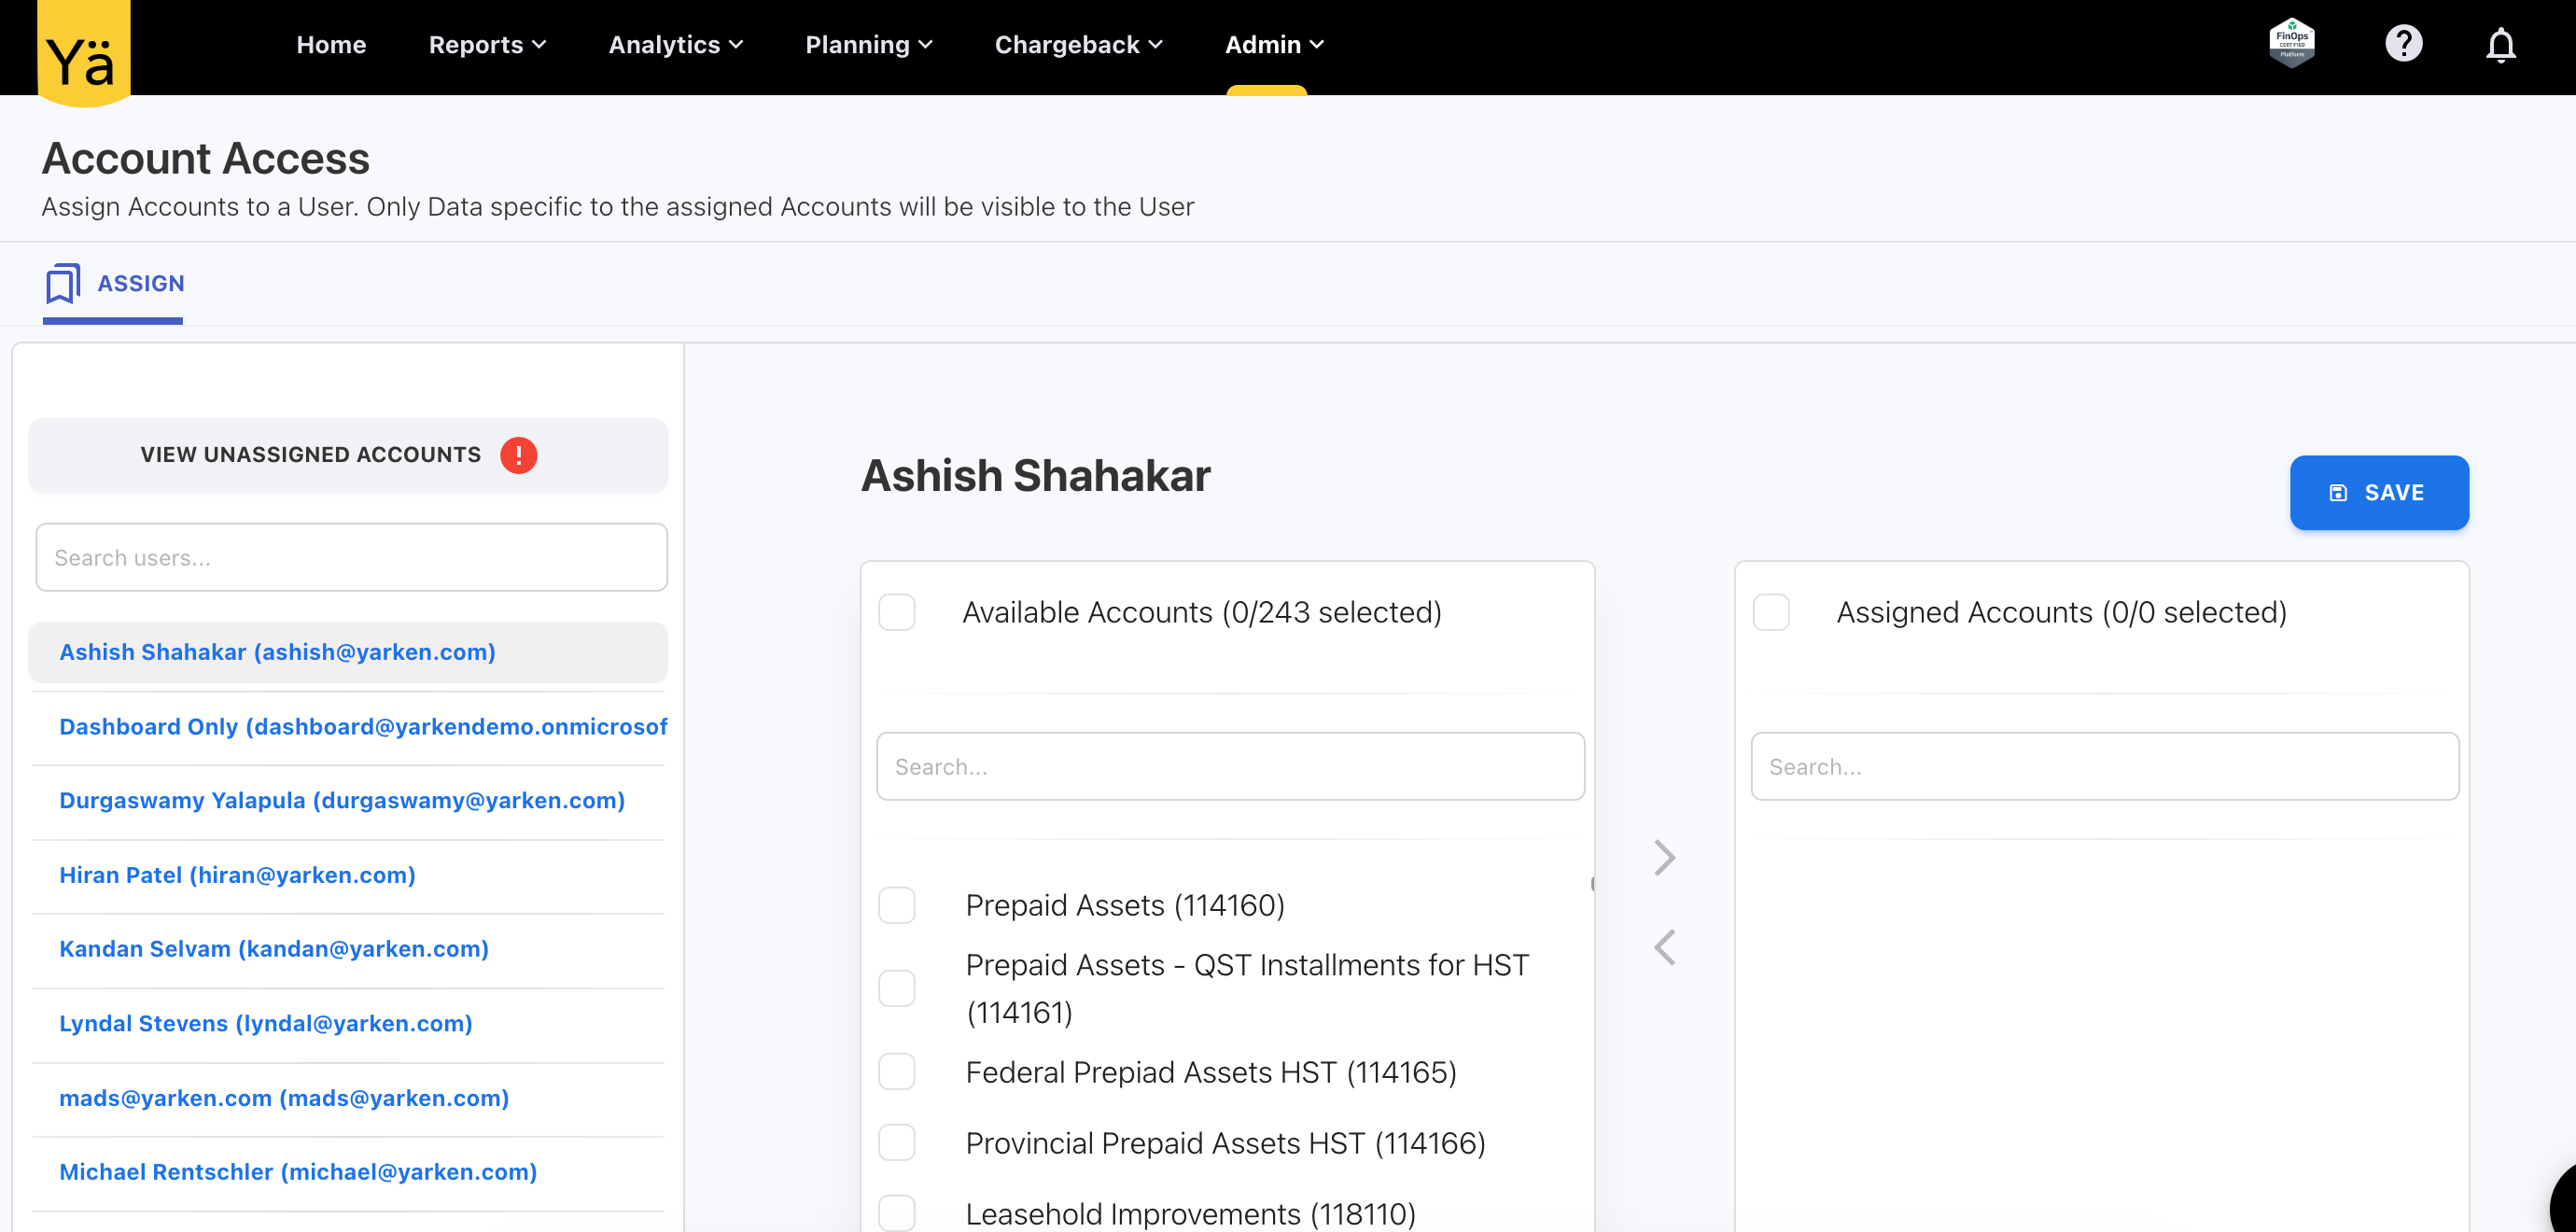
User Management: Account Level Access
Restrict data visibility based on assigned accounts. This enhancement ensures users only see data relevant to their specific remit across all dashboards and reports.
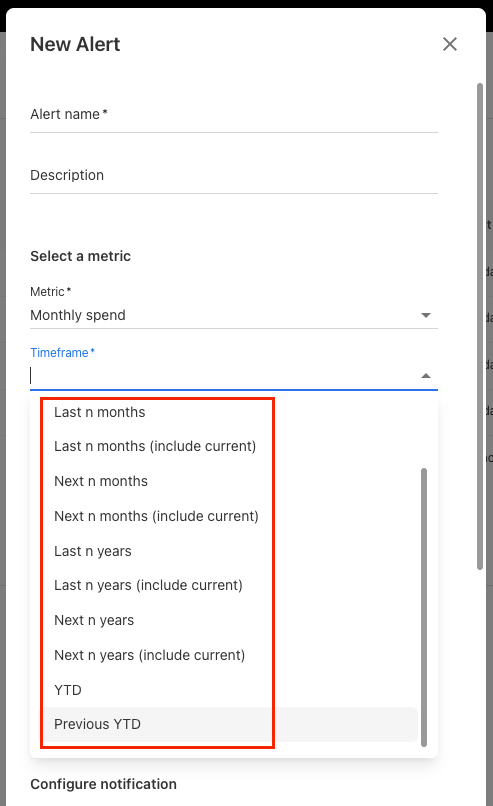
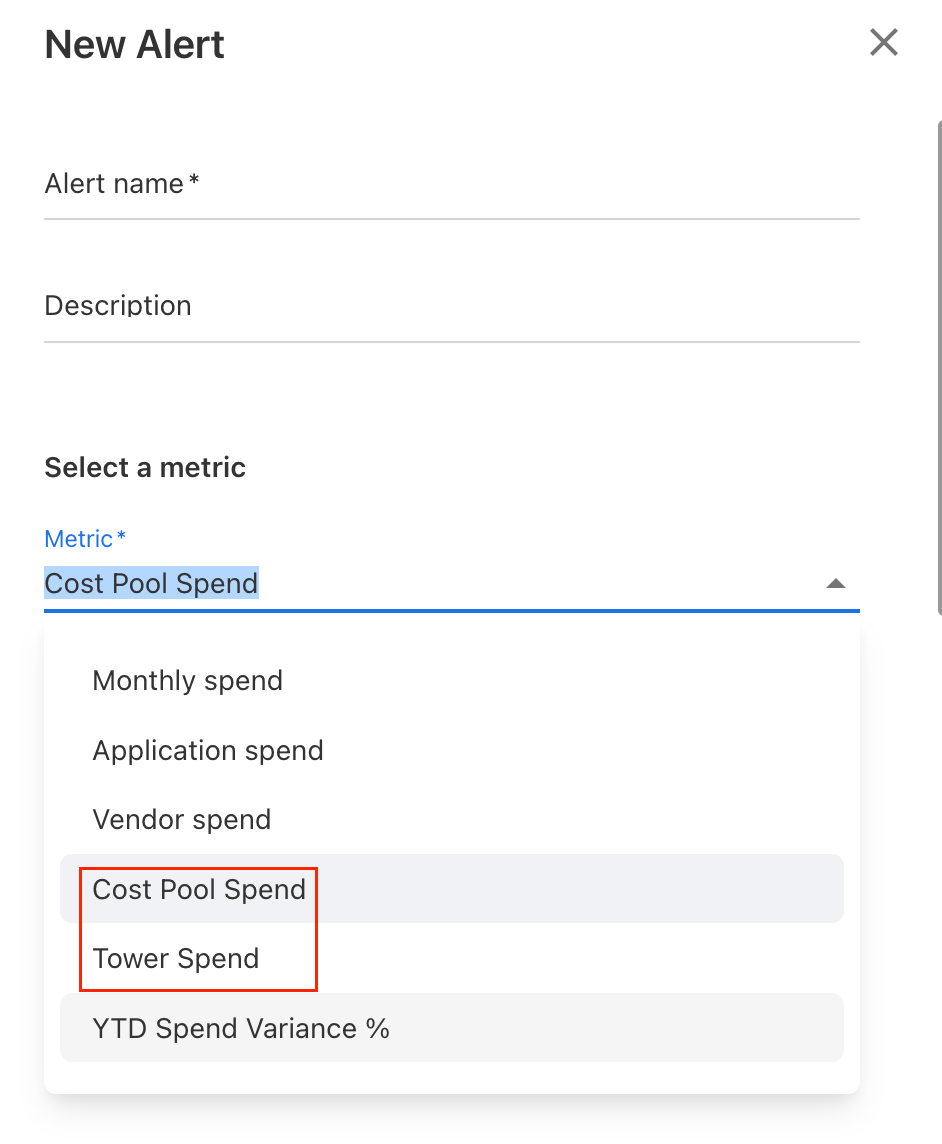
Alerting Enhancements
New Metric Types
You can now set alerts specifically for Cost Pool Spend and Tower Spend, monitoring when spend deviates from defined thresholds.
Expanded Timeframes
Greater flexibility in defining periods for evaluation: Last/Next n months, Year to Date (YTD), and Previous YTD comparisons.